About dTwin
Understand your Assets better
You already have a lot of data about your asset. But it’s in siloed sources. To unlock value you need an open platform that provides a golden thread of data. dTwin is technically agnostic. It collects real-time data from any source, format, or device, connects it and makes it easy to understand and act on. Customizable dashboards and reports and 3D visualization make data understandable.
What do you need to understand your built assets?
To understand your building, you need data above all else. But data alone does not make you happy. Data is often isolated in different solutions or spreadsheets. It is often outdated or can only be understood with expert knowledge. Or there is an overload of useless data.
To truly understand your buildings, you need a platform that brings all the data together. This means no information is lost, the data is put into context and you can understand the connections. This allows you to create analyzes across all building data.
But so that you don't have to be a data analyst to understand all this information, it's important that the data is presented in user-friendly dashboards and graphs. The dashboards should be customizable to meet your individual requirements. Finally, visualizing the data in the 3D replicas of your buildings ensures that you truly understand them.

dTwin connects - among many others - this data:
1. IoT sensor data: dTwin can process real-time data from every IoT sensor.
2. CAFM data: Your facility management software can be connected to dTwin.
3. BMS data: dTwin connects to your building management system.
4. ERP data: Data from your ERP solution can also be handled by dTwin.
5. BIM data: dTwin not only uses BIM data to visualize the 3D model of your building. You can also work with the element data.
dTwin Analytics Functionalities
-
dTwin connects all data sources: Visualization data, real-time data from IoT sensors, data from other solutions you have in use, even data from spreadsheets.
-
With dTwin you can access real-time date from your IoT sensors and display them at their real location in the building. But you can also anaylze the historical data of the sensors.
-
dTwin allows you to build your own dashboards and reports the way you need them quick and easy.
-
With dTwin you not only have access to the current state of your building. You can lokk at every documented state of your built asset and even compare the different versions.
-
Analyze your building with dtwin without being on-site. You can use the 3D visualization to execute measurements. You can find every information or building part quickly with user-freindly search and filter functionalities.
-
dTwin is an open platform that supports open standard formats and can import and connect data of all kinds via the open API.
Analytics Use Cases
-
By analyzing data from various building systems, managers can identify energy inefficiencies and optimize usage, leading to reduced energy costs and improved sustainability.
-
Data analytics can predict equipment failures before they occur, allowing for timely maintenance and reducing downtime and repair costs.
-
Analyzing data on temperature, lighting, and air quality helps tailor the indoor environment to occupant preferences, enhancing comfort and productivity.
-
Data on how spaces are used can help optimize layouts and improve space management, ensuring that areas are used efficiently.
-
Analytics can enhance security by monitoring access points and identifying unusual patterns, as well as improving safety by predicting and preventing potential hazards.
-
Data analytics helps track and manage a building's carbon footprint, supporting sustainability goals and regulatory compliance
dTwin makes it easy to understand your Buildings
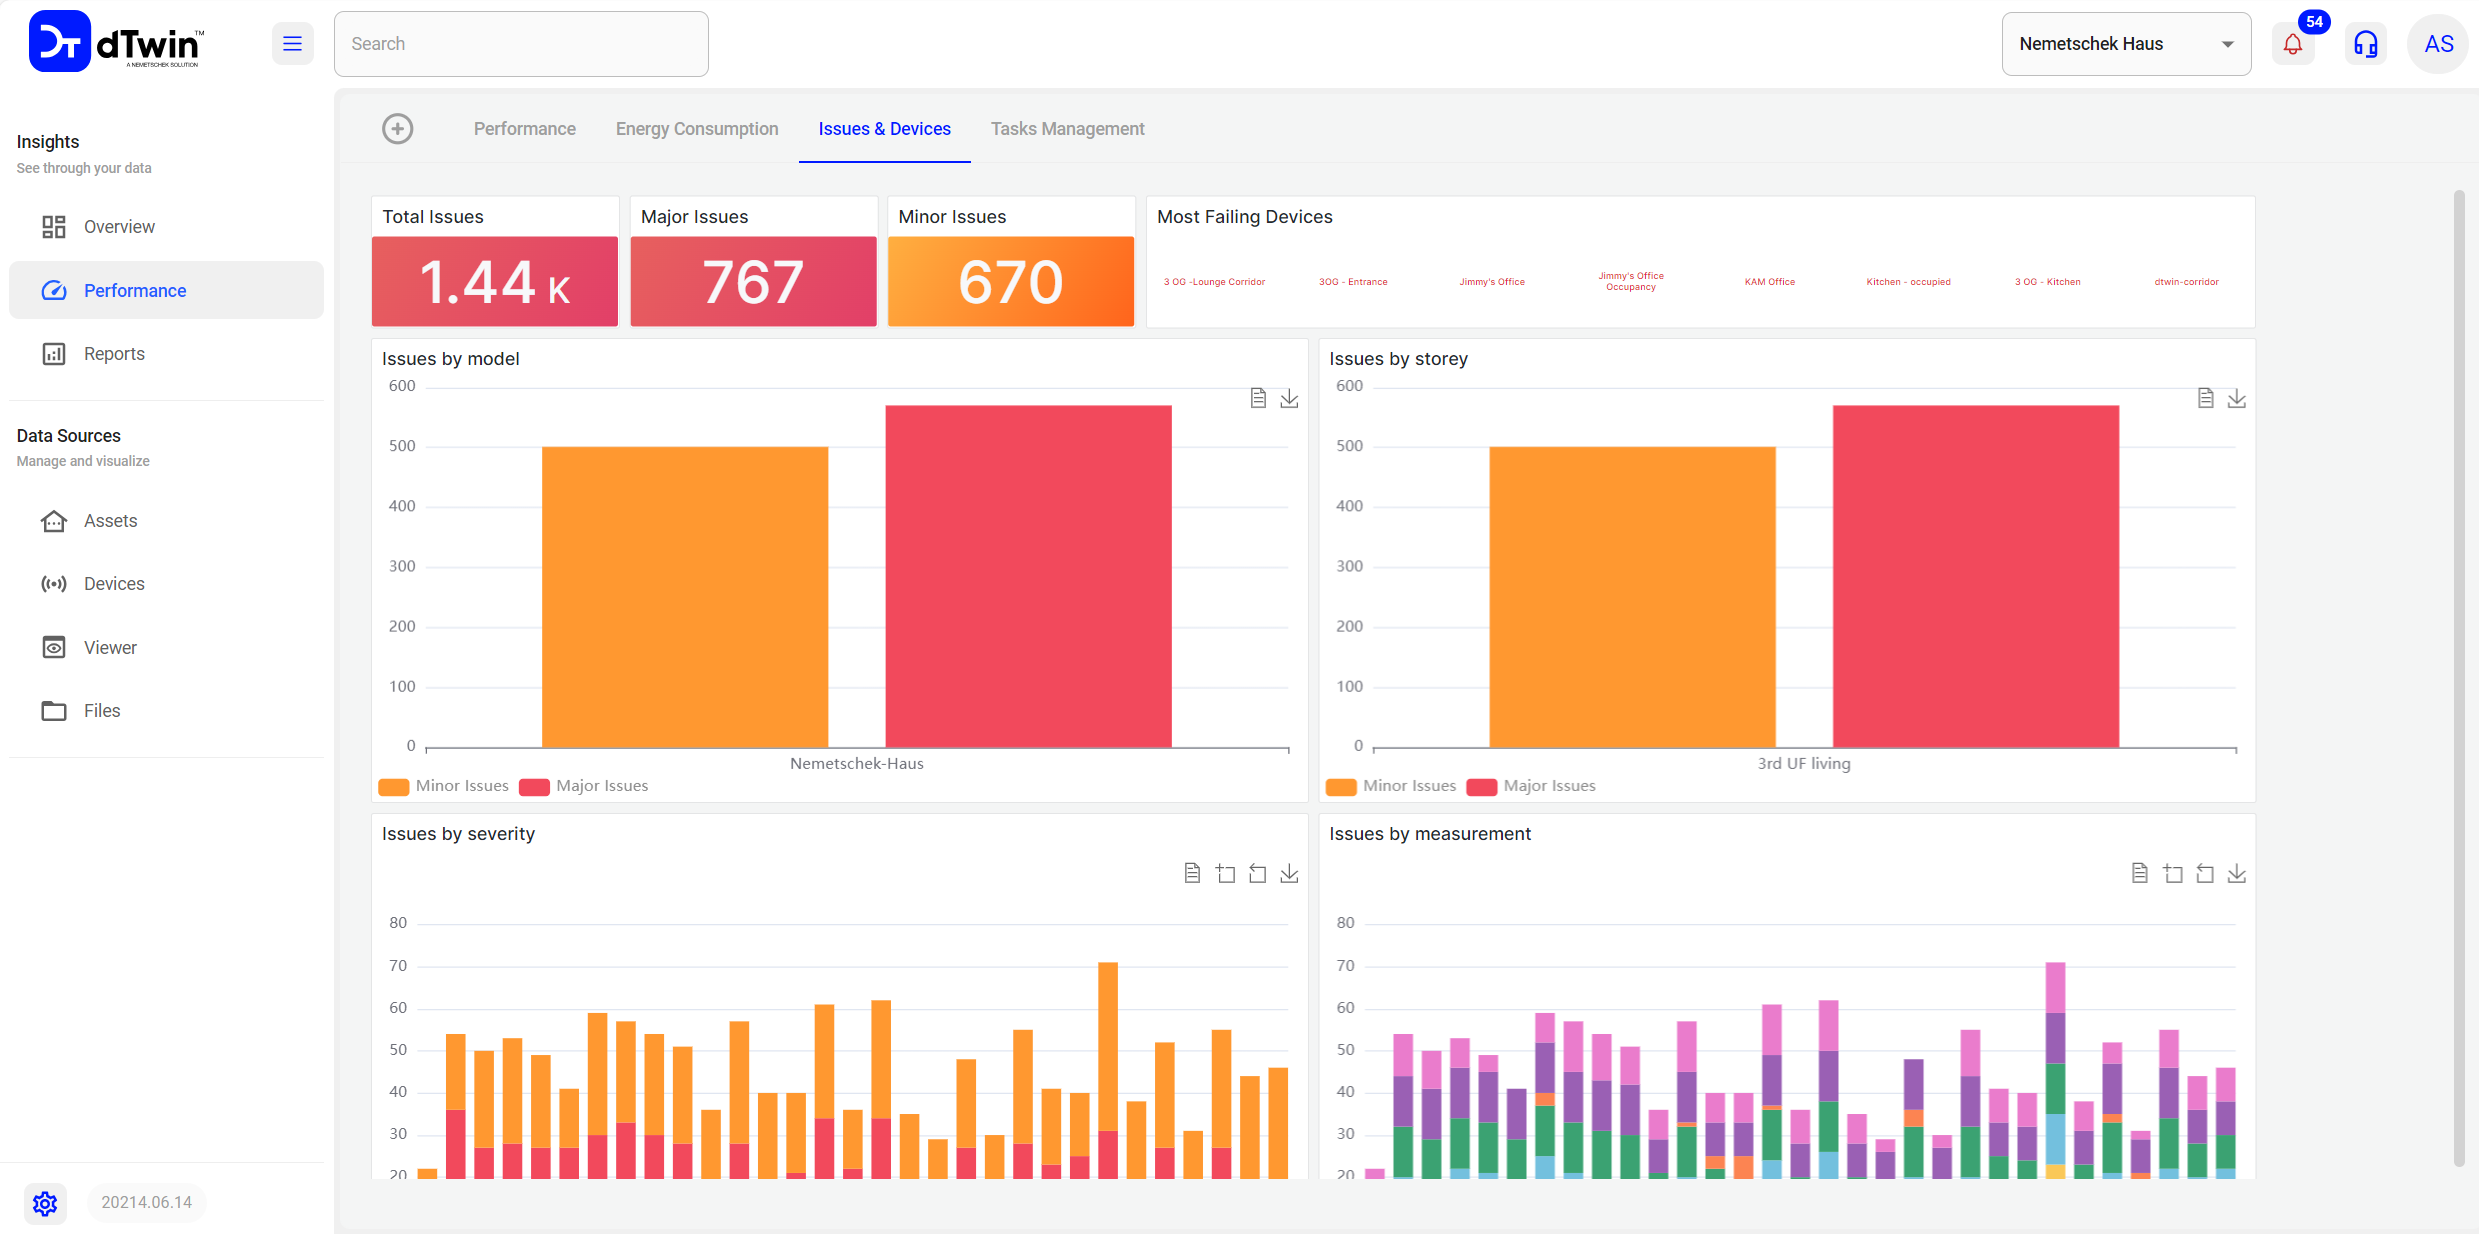
dTwin connects data from all systems and devices and contextualize it. So you can analyze your building across all data sources and get the complete picture. You can access real-time data but also look back and evaluate the historical data of your built asset to learn for the future.
Easy-to-use and customizable dashboards and reports are making data understandable and display any information you need the way you need it. dTwin localizes the data in your built asset, showing it at the right place and visualizes it in the 3D replica.
Learn more
Do you want to learn more about how dTwin helps you to analyze your buildings?
Learn more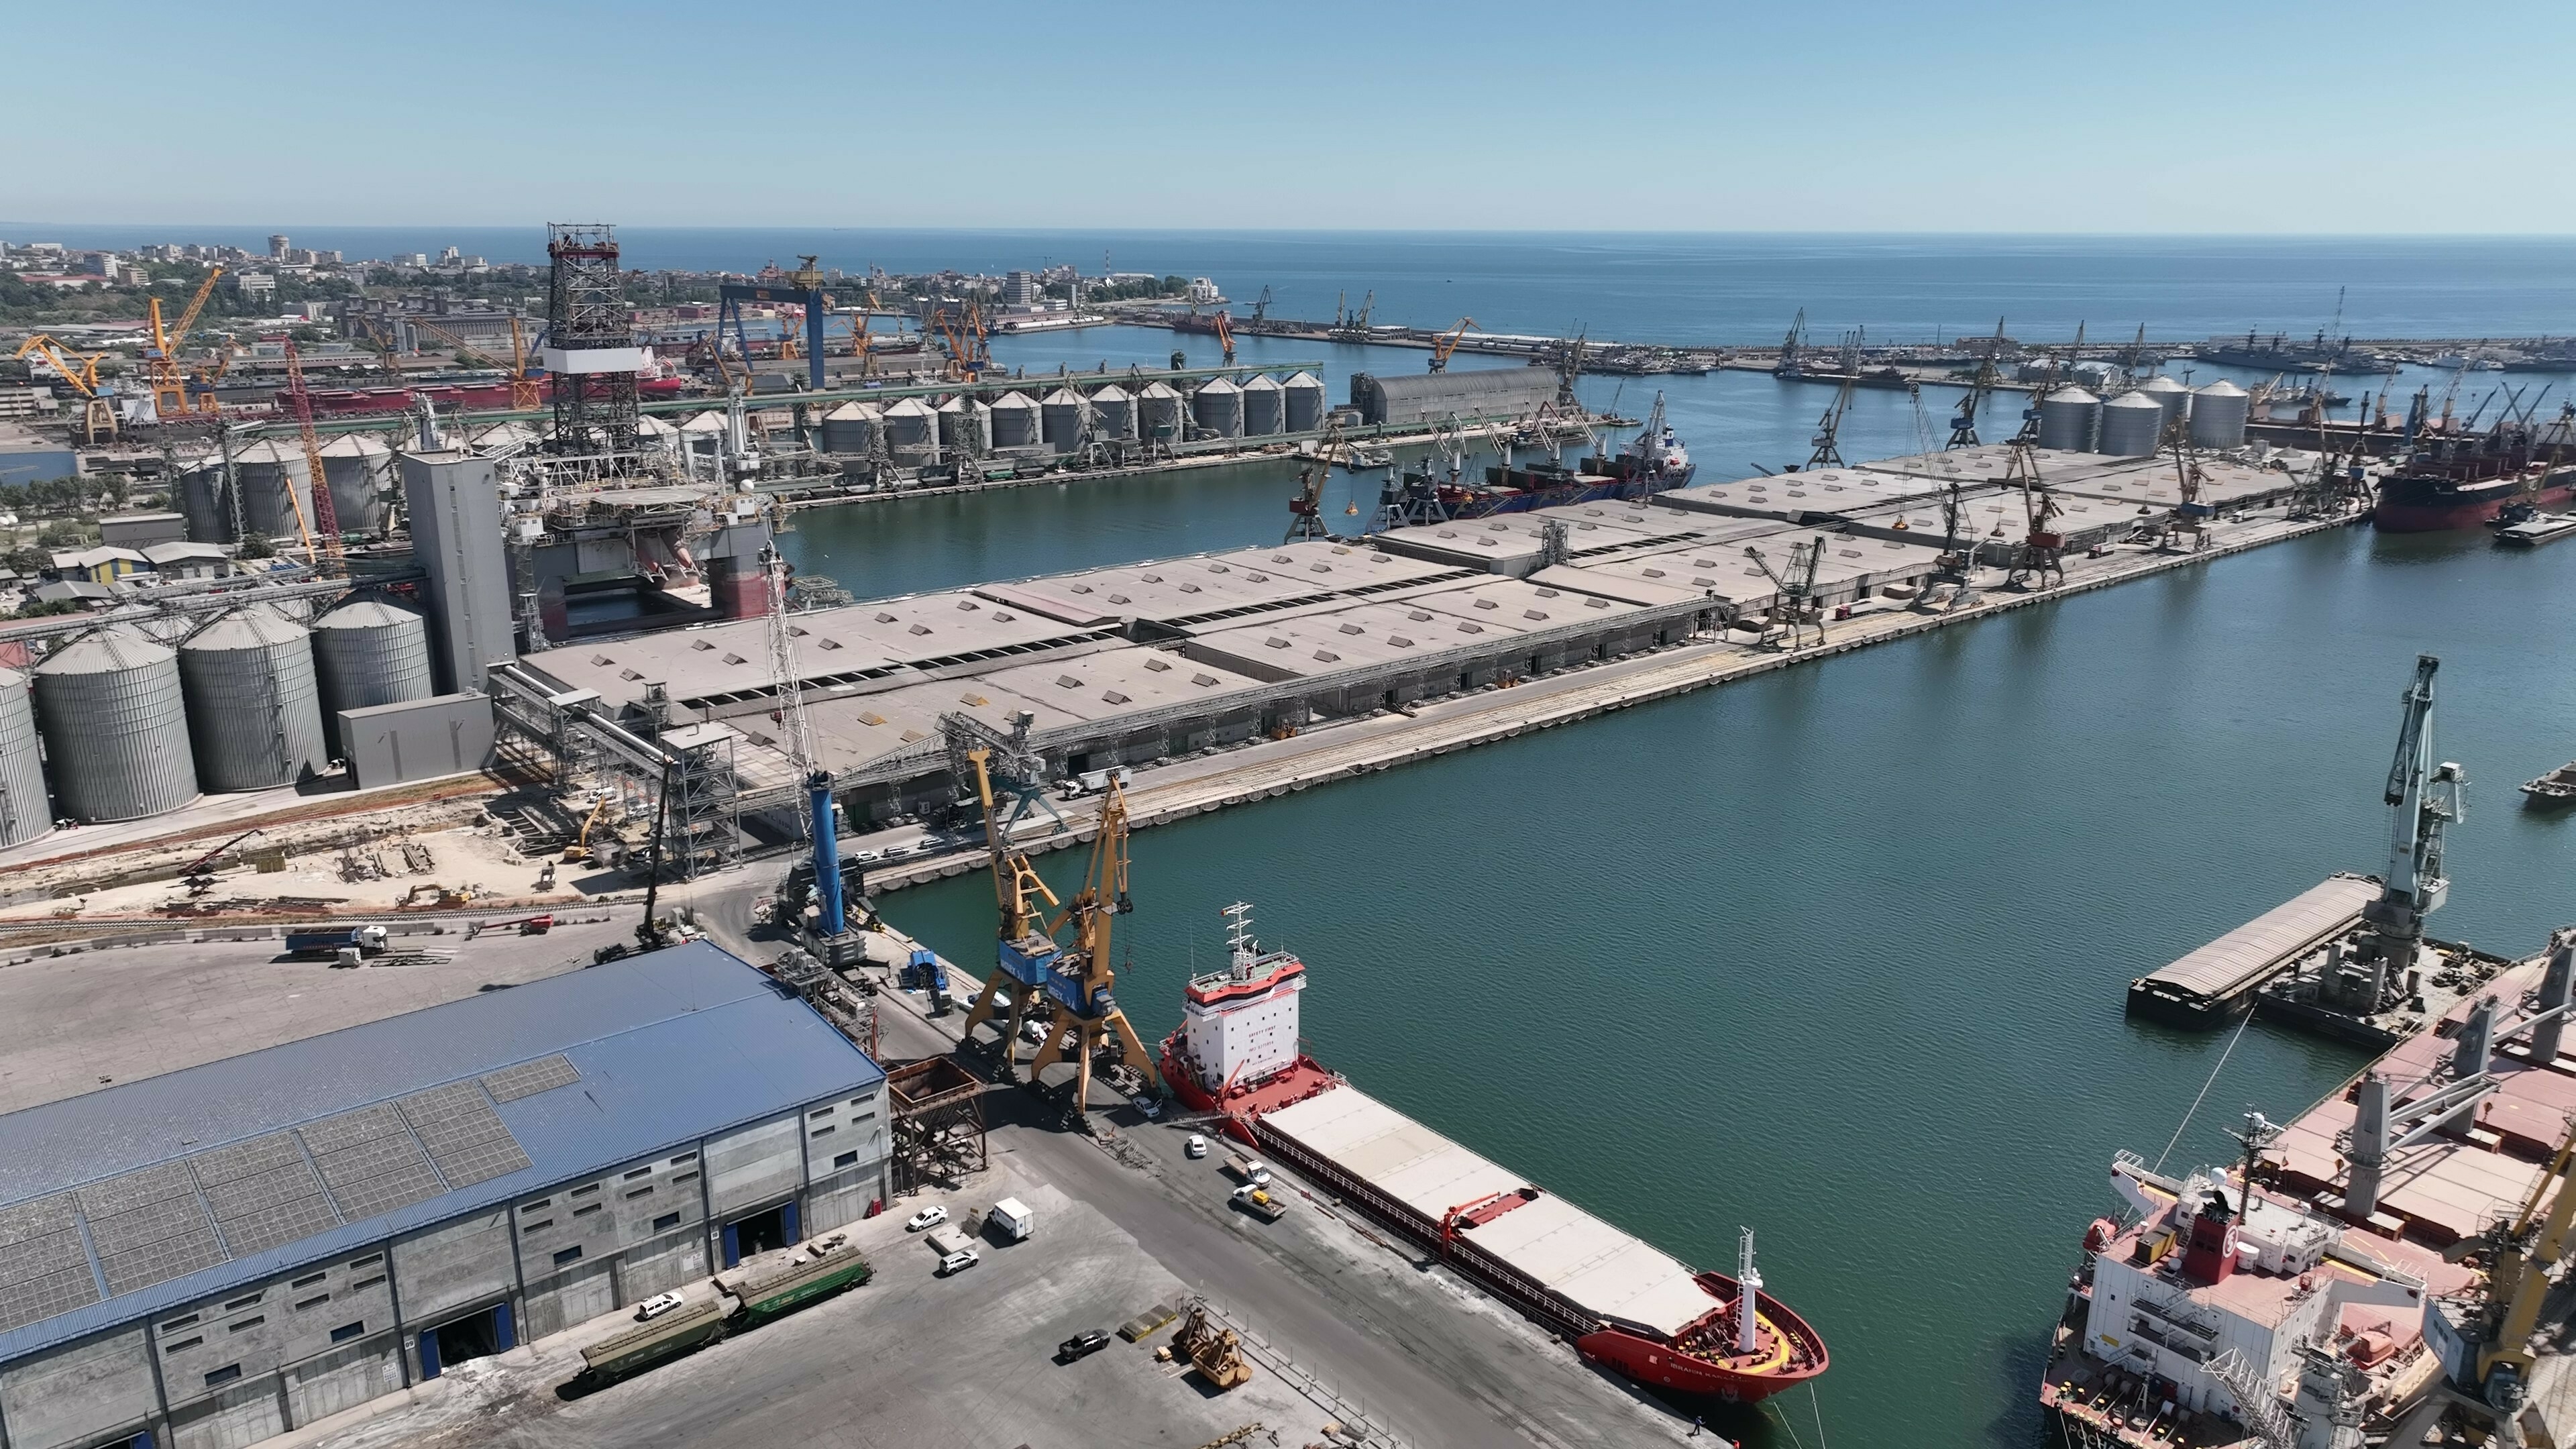
Customer story
Pioneering Innovation in Port Operations
To pioneer innovation in port operations, Romanian operator UMEX relies on Nemetschek dTwin to digitize berths, storage areas and warehouses and link it with real-time data. So Umex can monitor the entire ship unloading process and increase sustainably energy efficiency and productivity.
Discover